7.0 Reports
A number of pre-determined reports have been created in the system to show real-time data and stats on the caseload.
The system reports cover a variety of areas and information is displayed with clear, appealing graphics that can be printed at any time.
The Reports system is visible in the navigation and can be accessed by the these user groups:
Administrator
Director
Manager
Supervisor
Trainer
Coordinator
Read Only
Most reports include a date range feature and various filtering options.
Client Pool
Client Pool shows tabular data and graphs on the caseload for:
Number of active and inactive clients
Client education
Client gender
Client location
Clients with criminal records
Client employment status
Client age ranges
Client Employment
Client Employment shows tabular data and graphs for employed clients based on:
Employment industry
Location of employed clients
Client employment status
Employed client age ranges
Employed client gender
Employed client education
Employed clients with criminal records
Employed clients by Casemanager
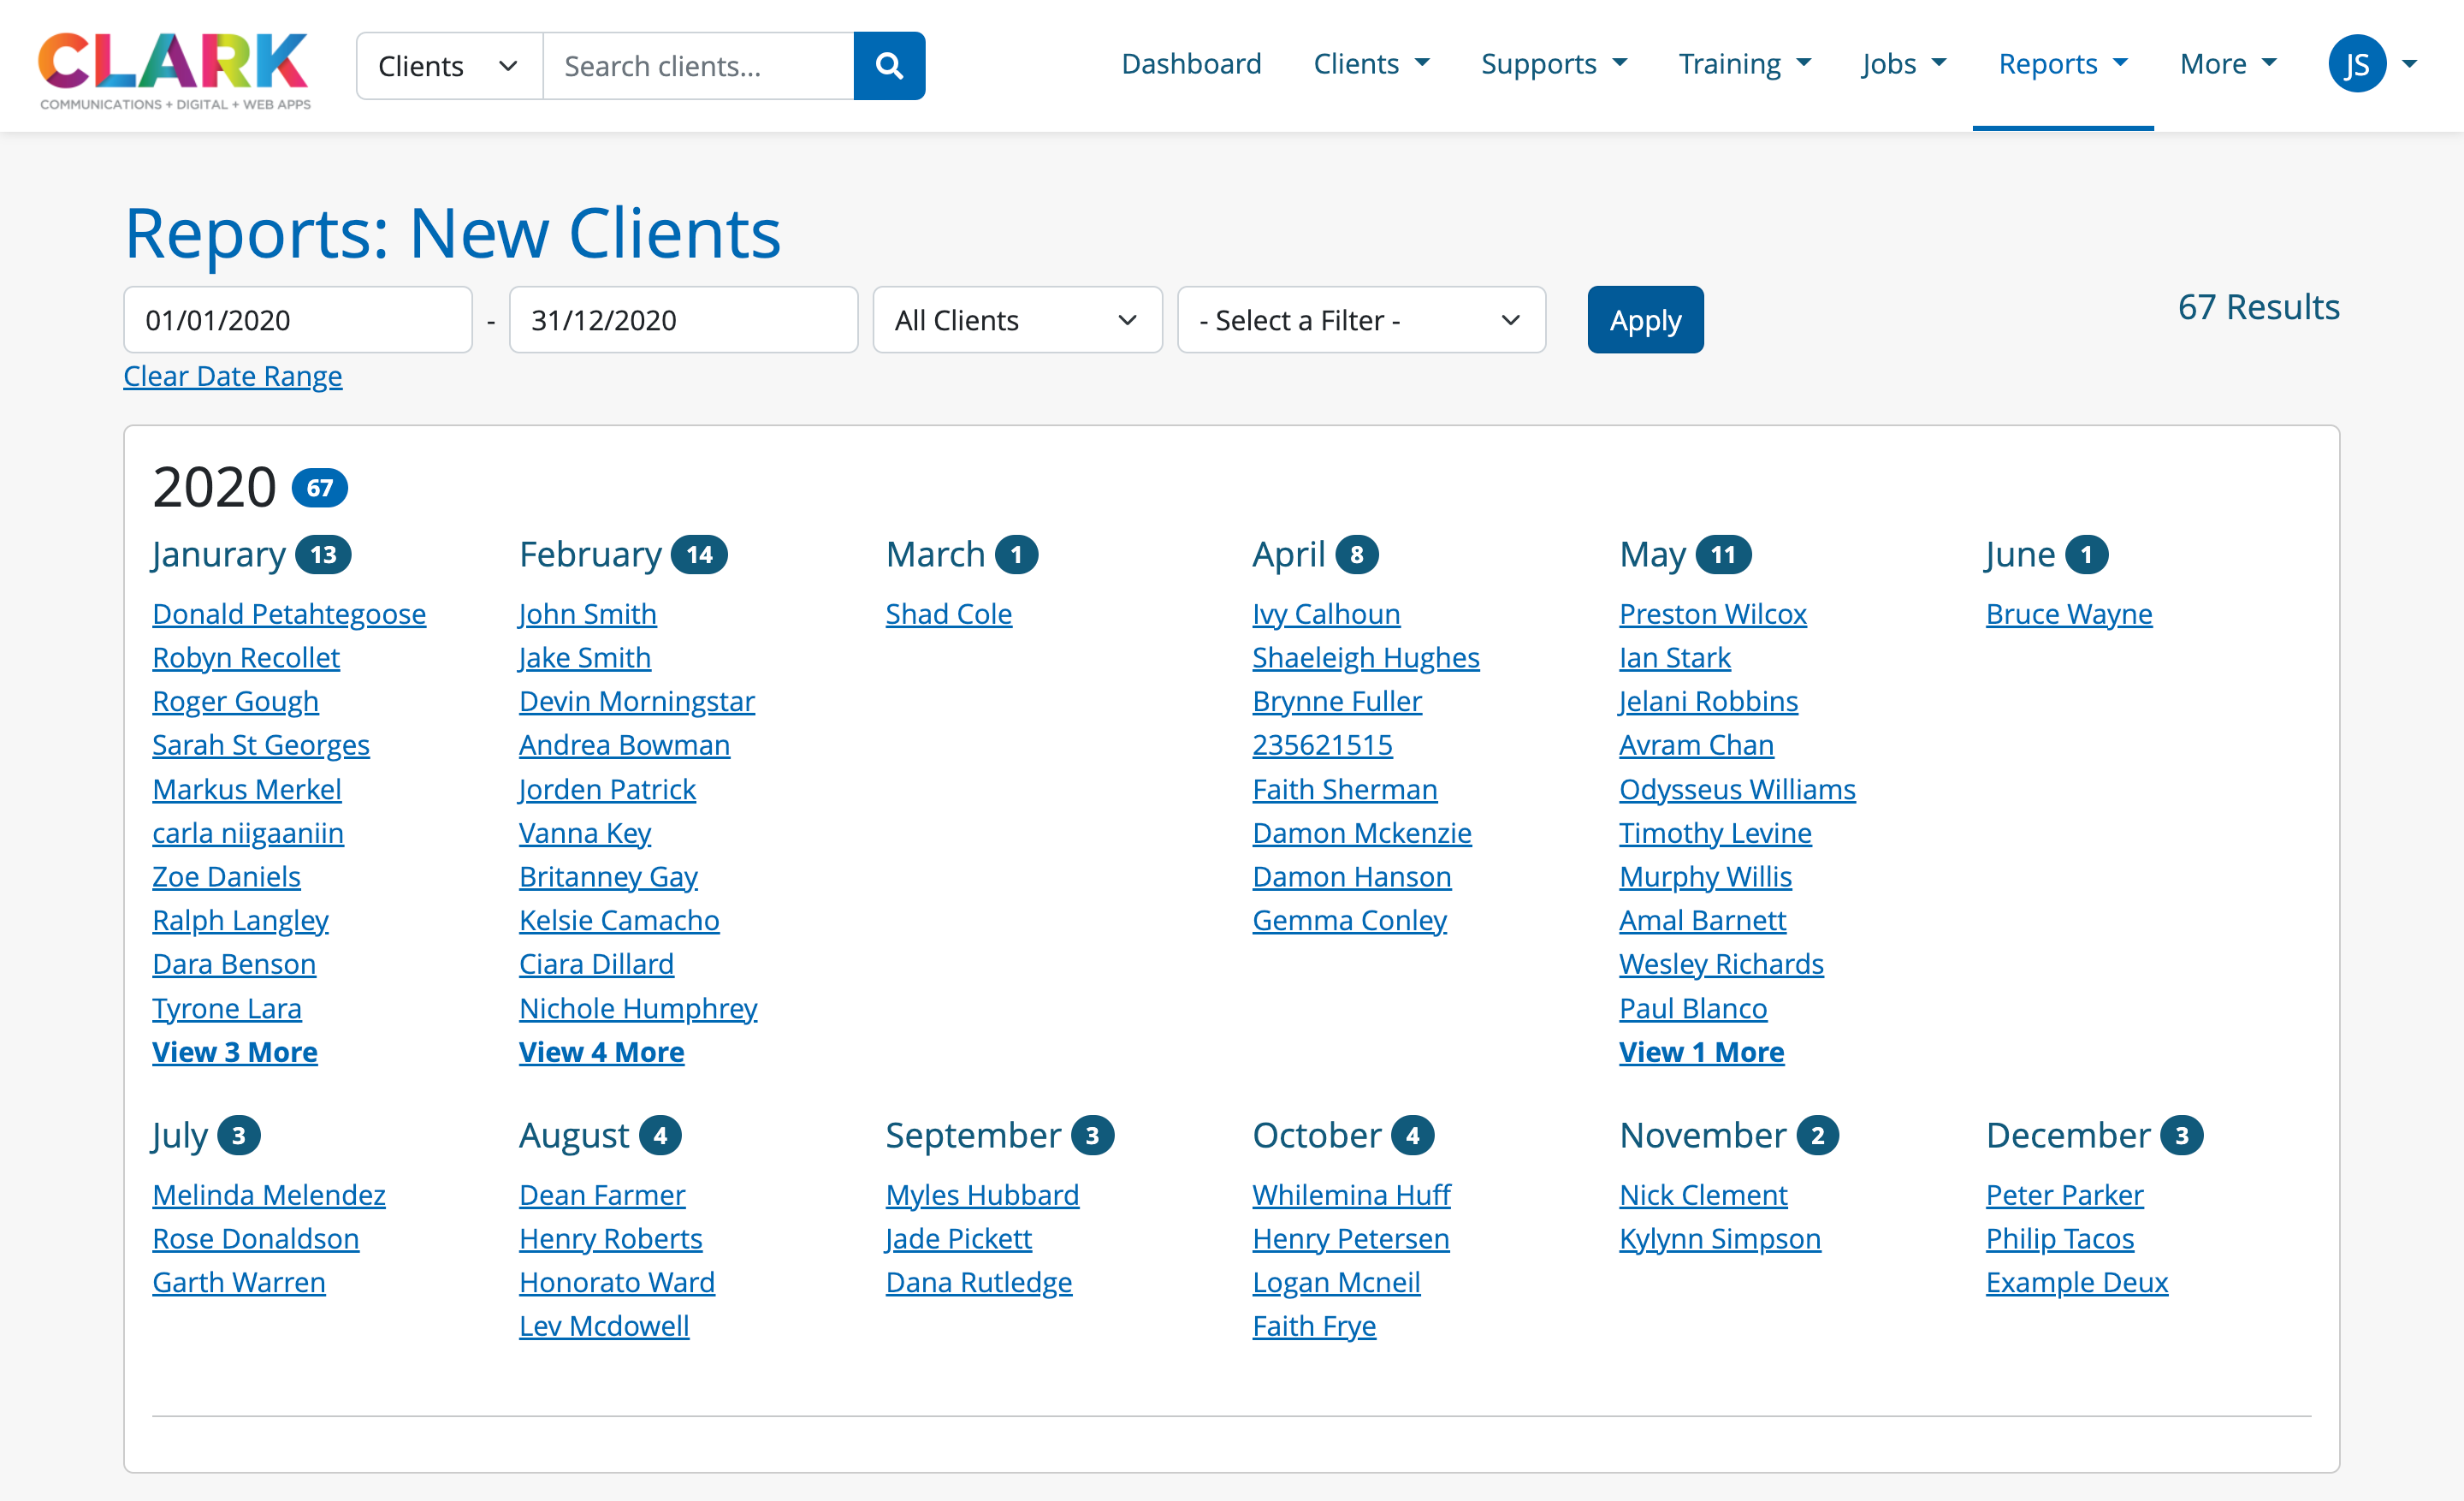
New Clients
New Clients shows the number of new clients added in the system each month and year
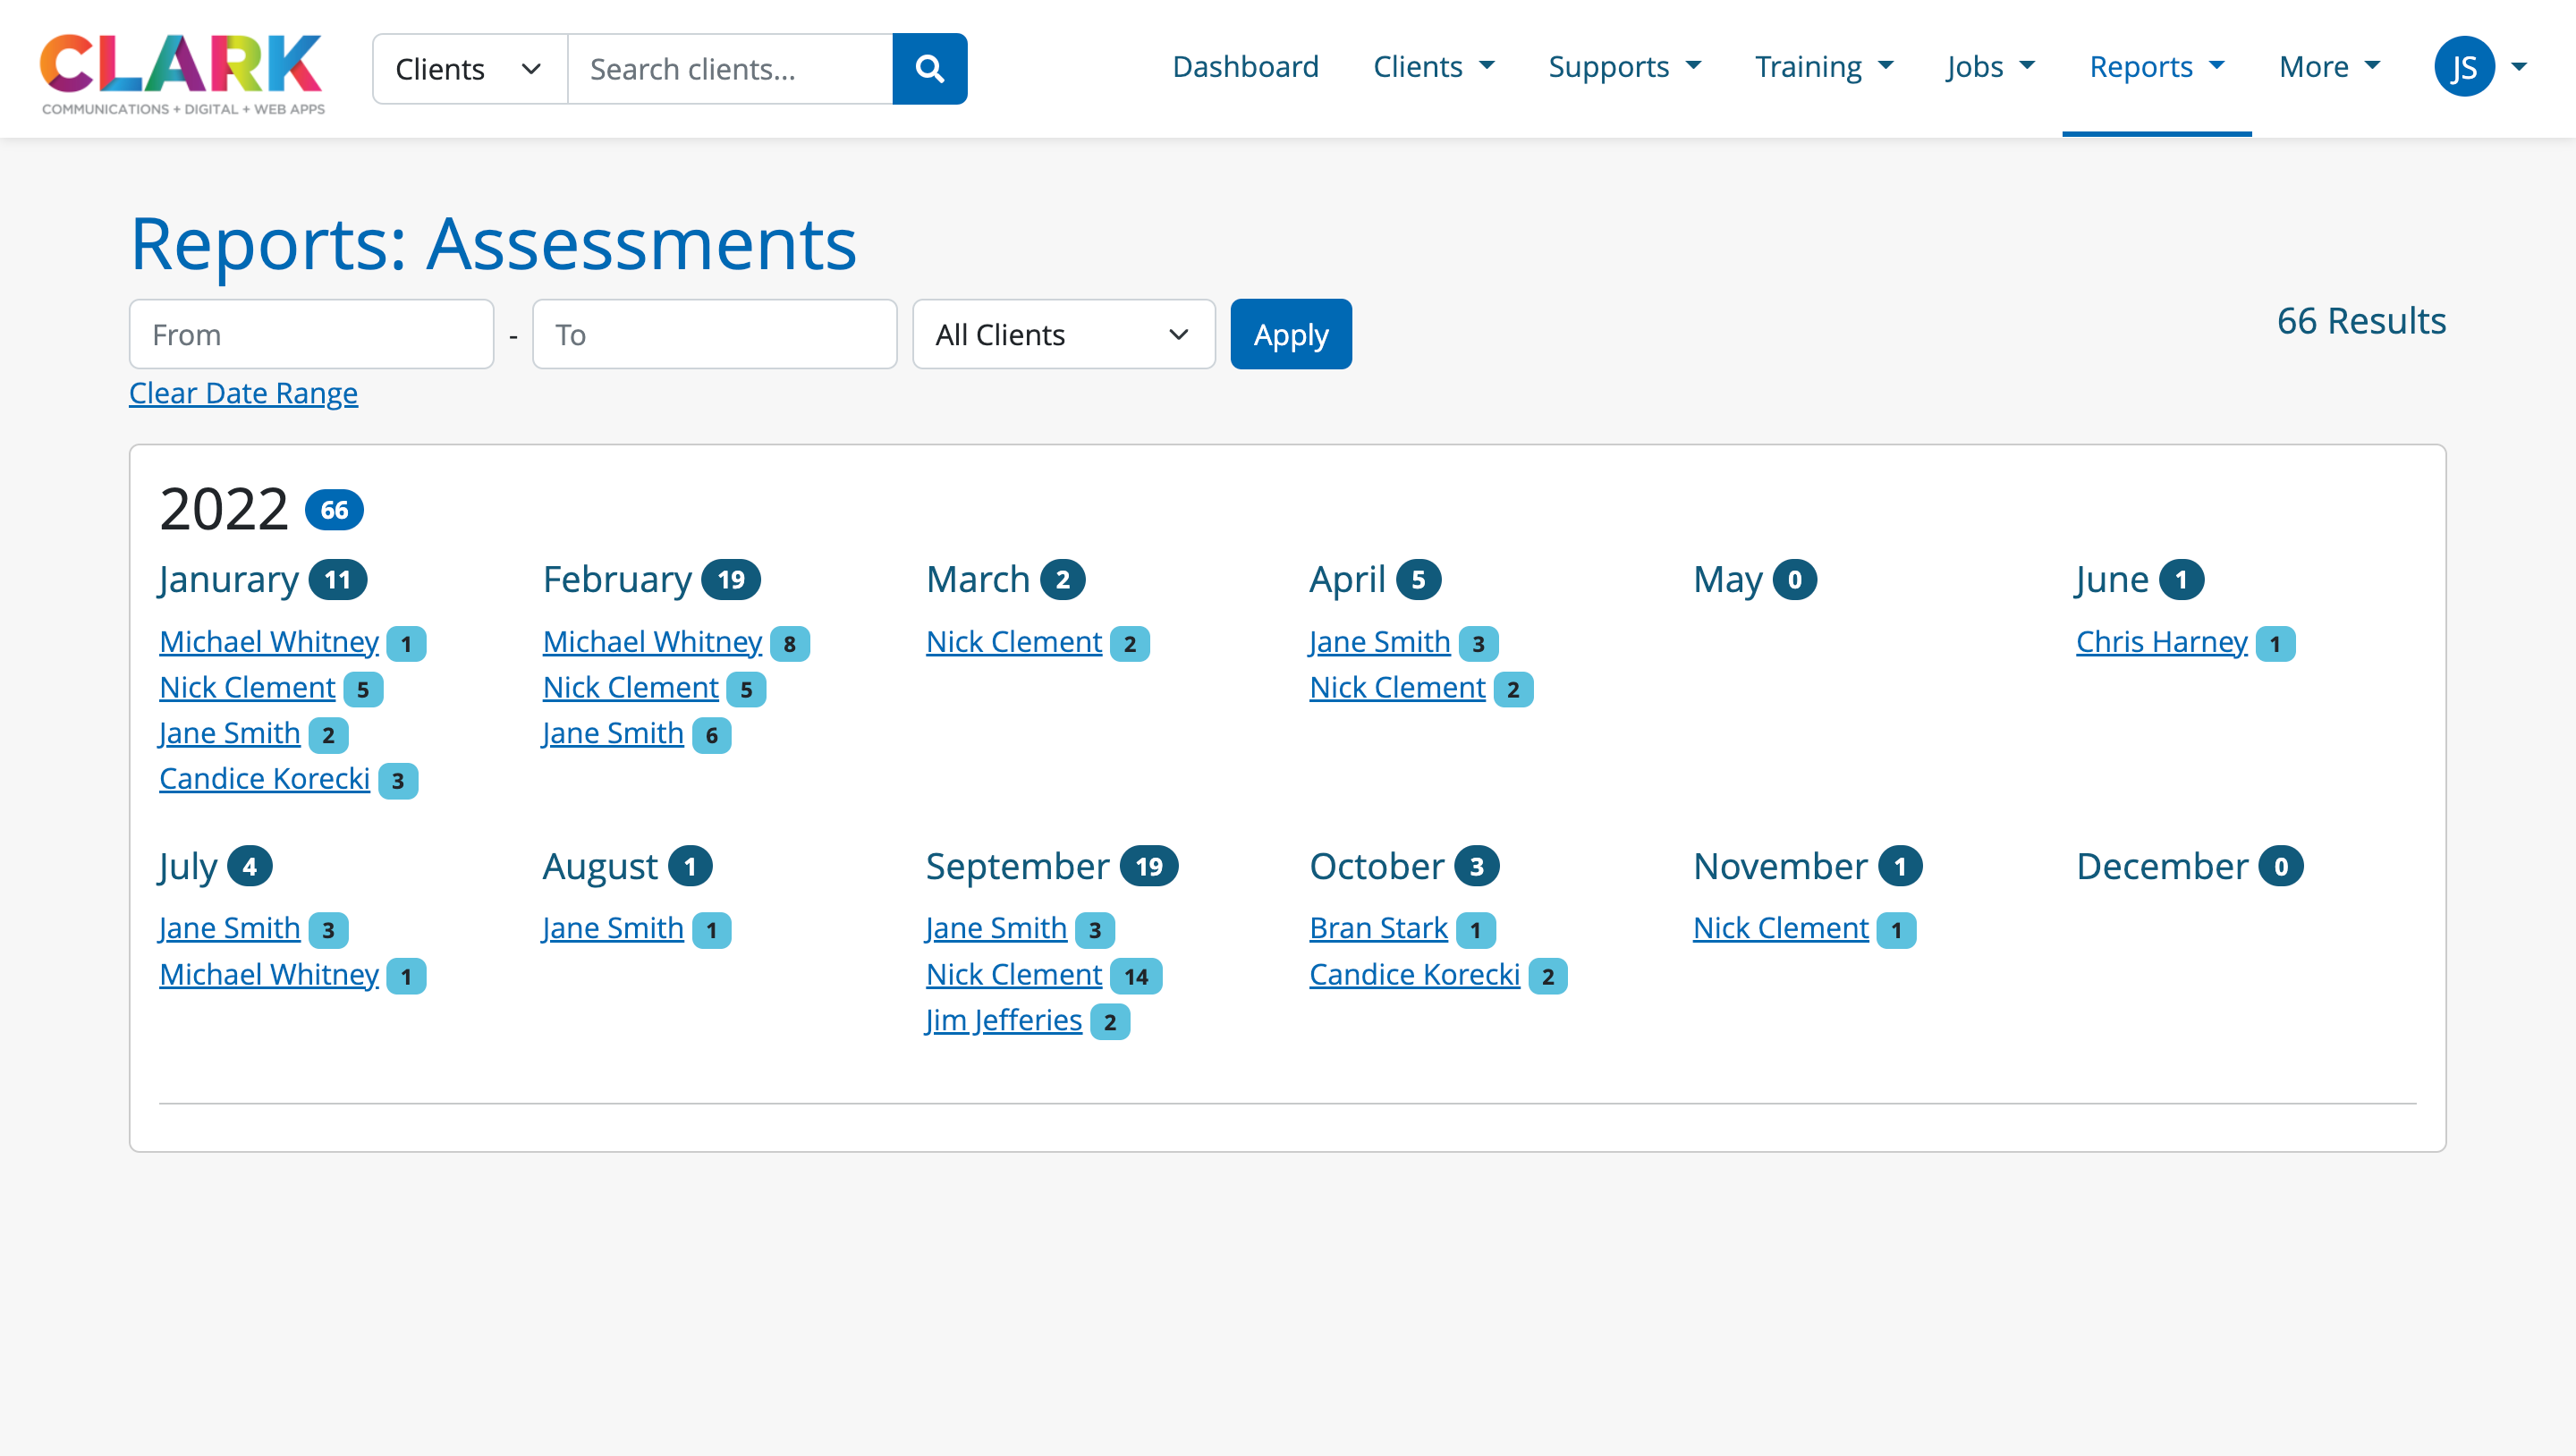
Assessments
Assessments shows the number of assessments completed each month and year, with a breakdown of the number of assessments completed by a Casemanager each month
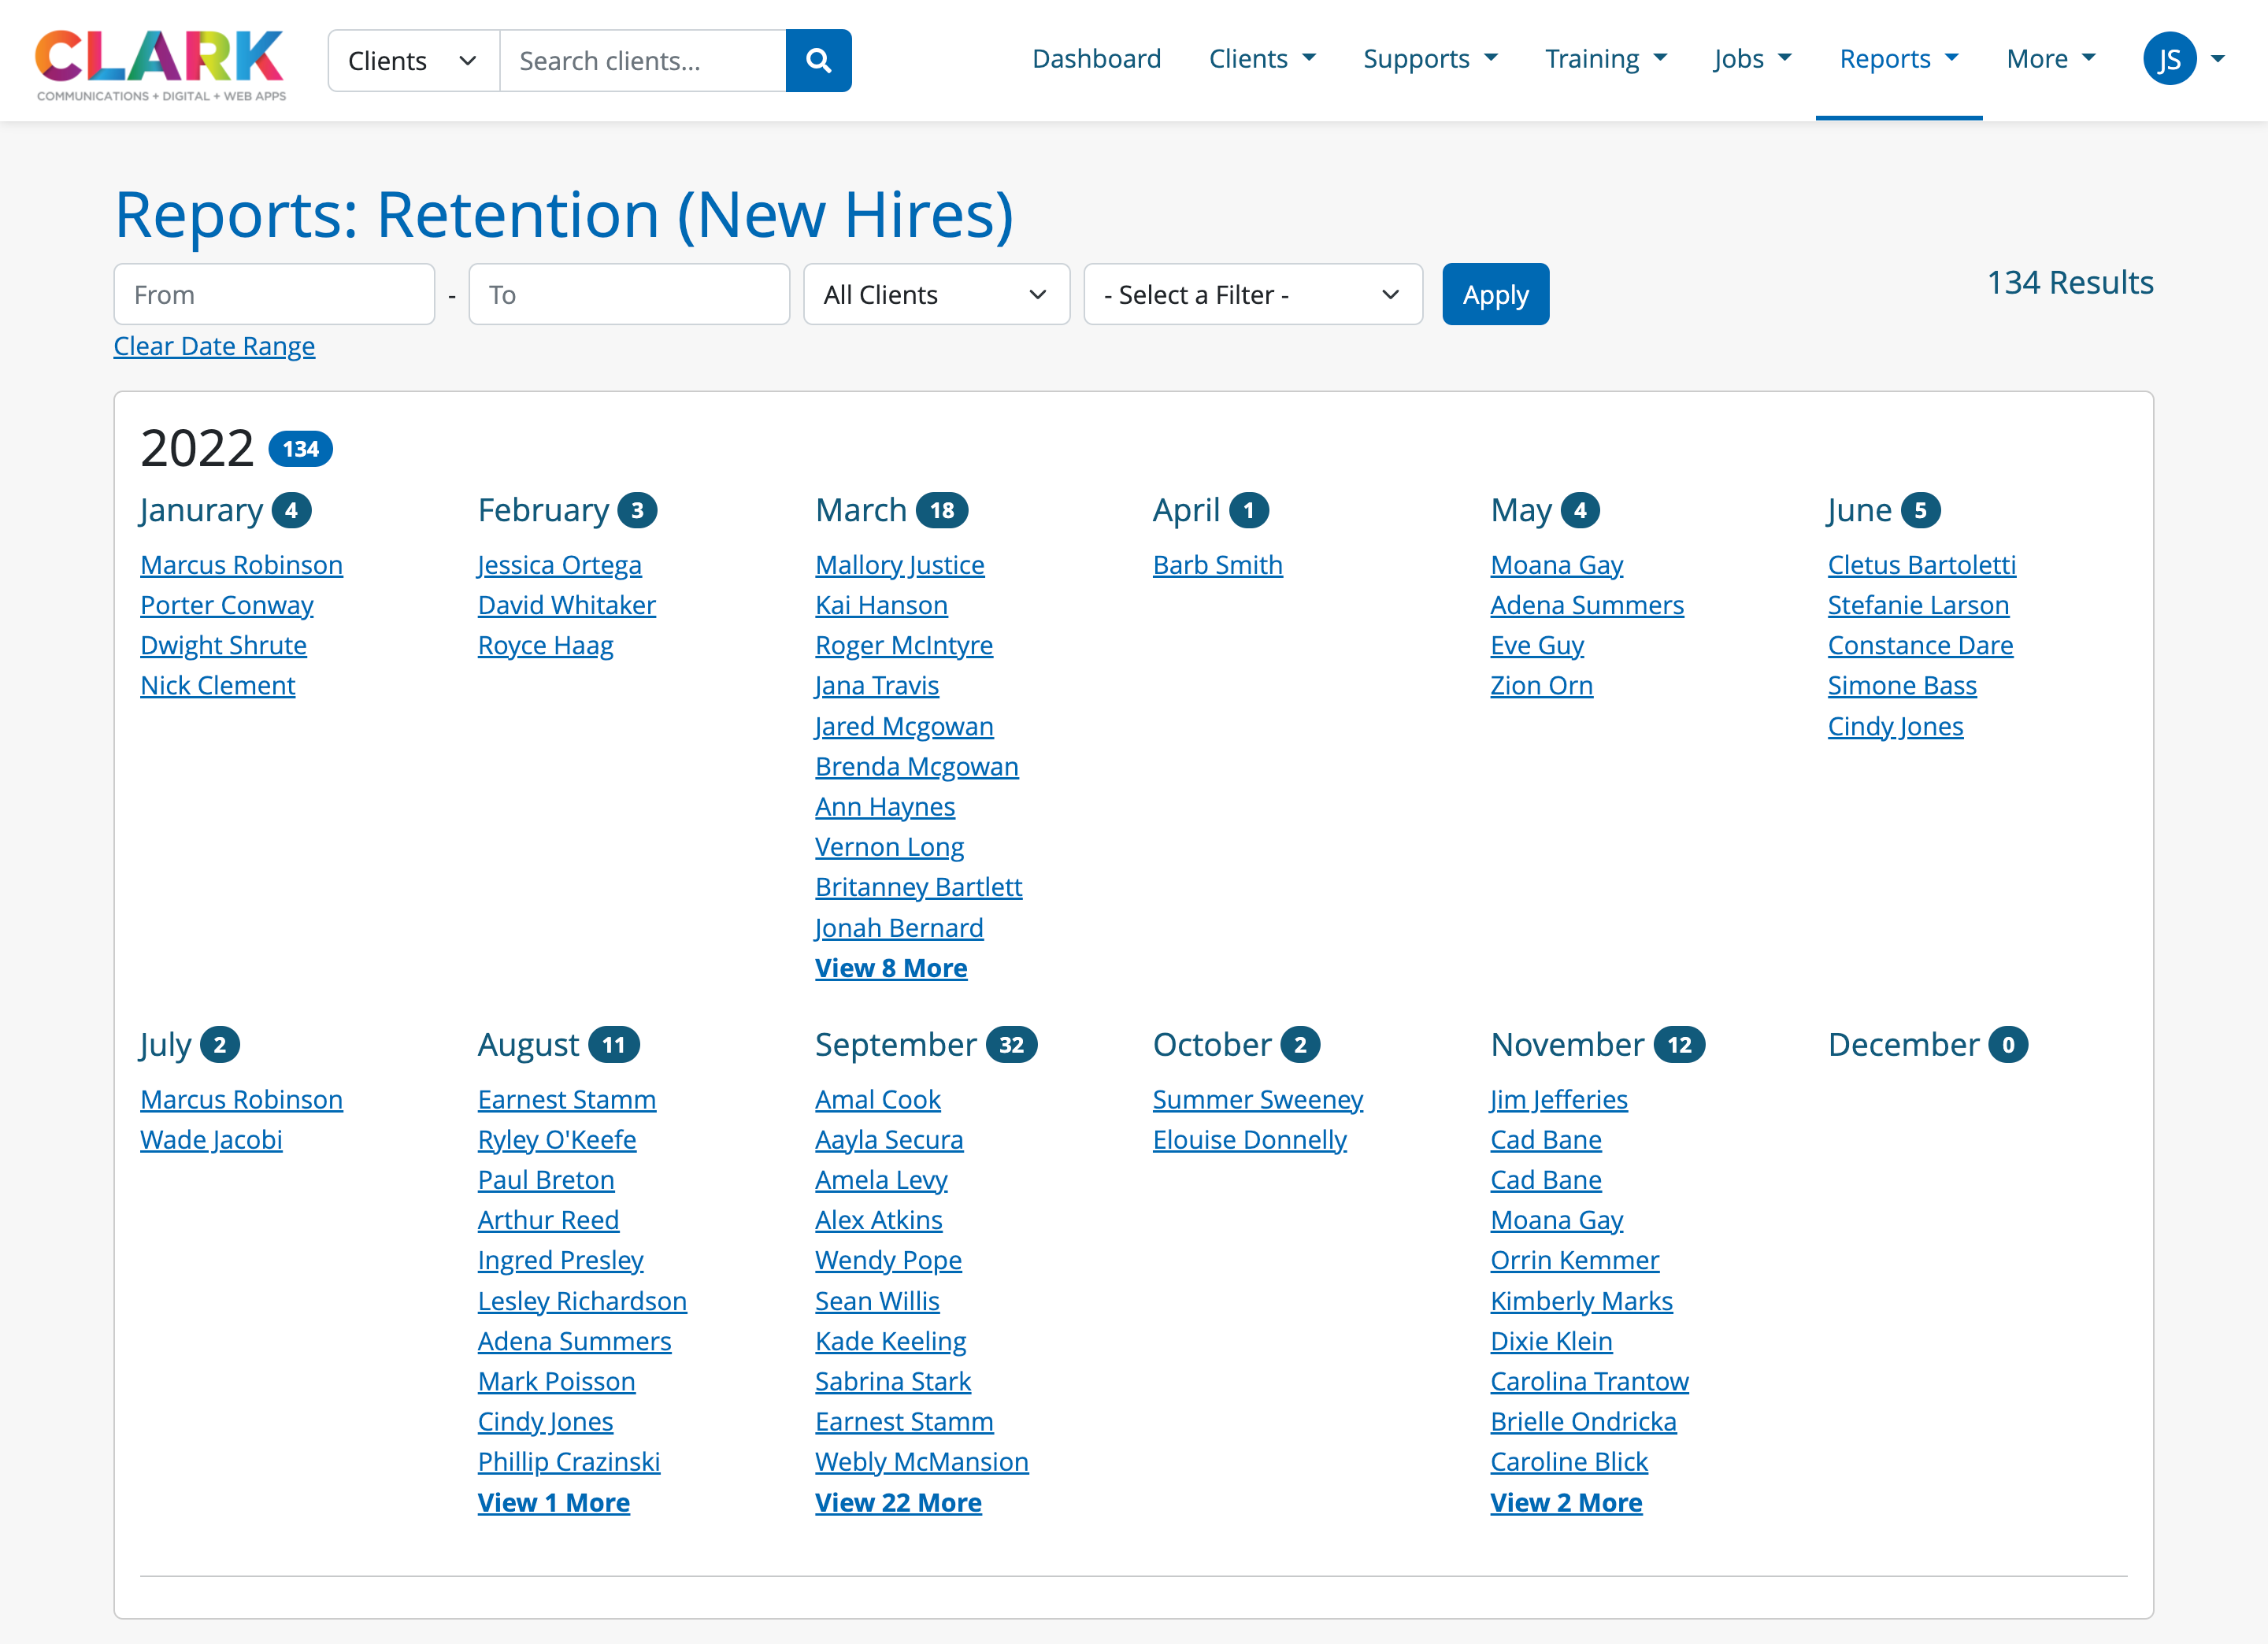
Retention
Retention shows the number of new hires added in the system each month and year
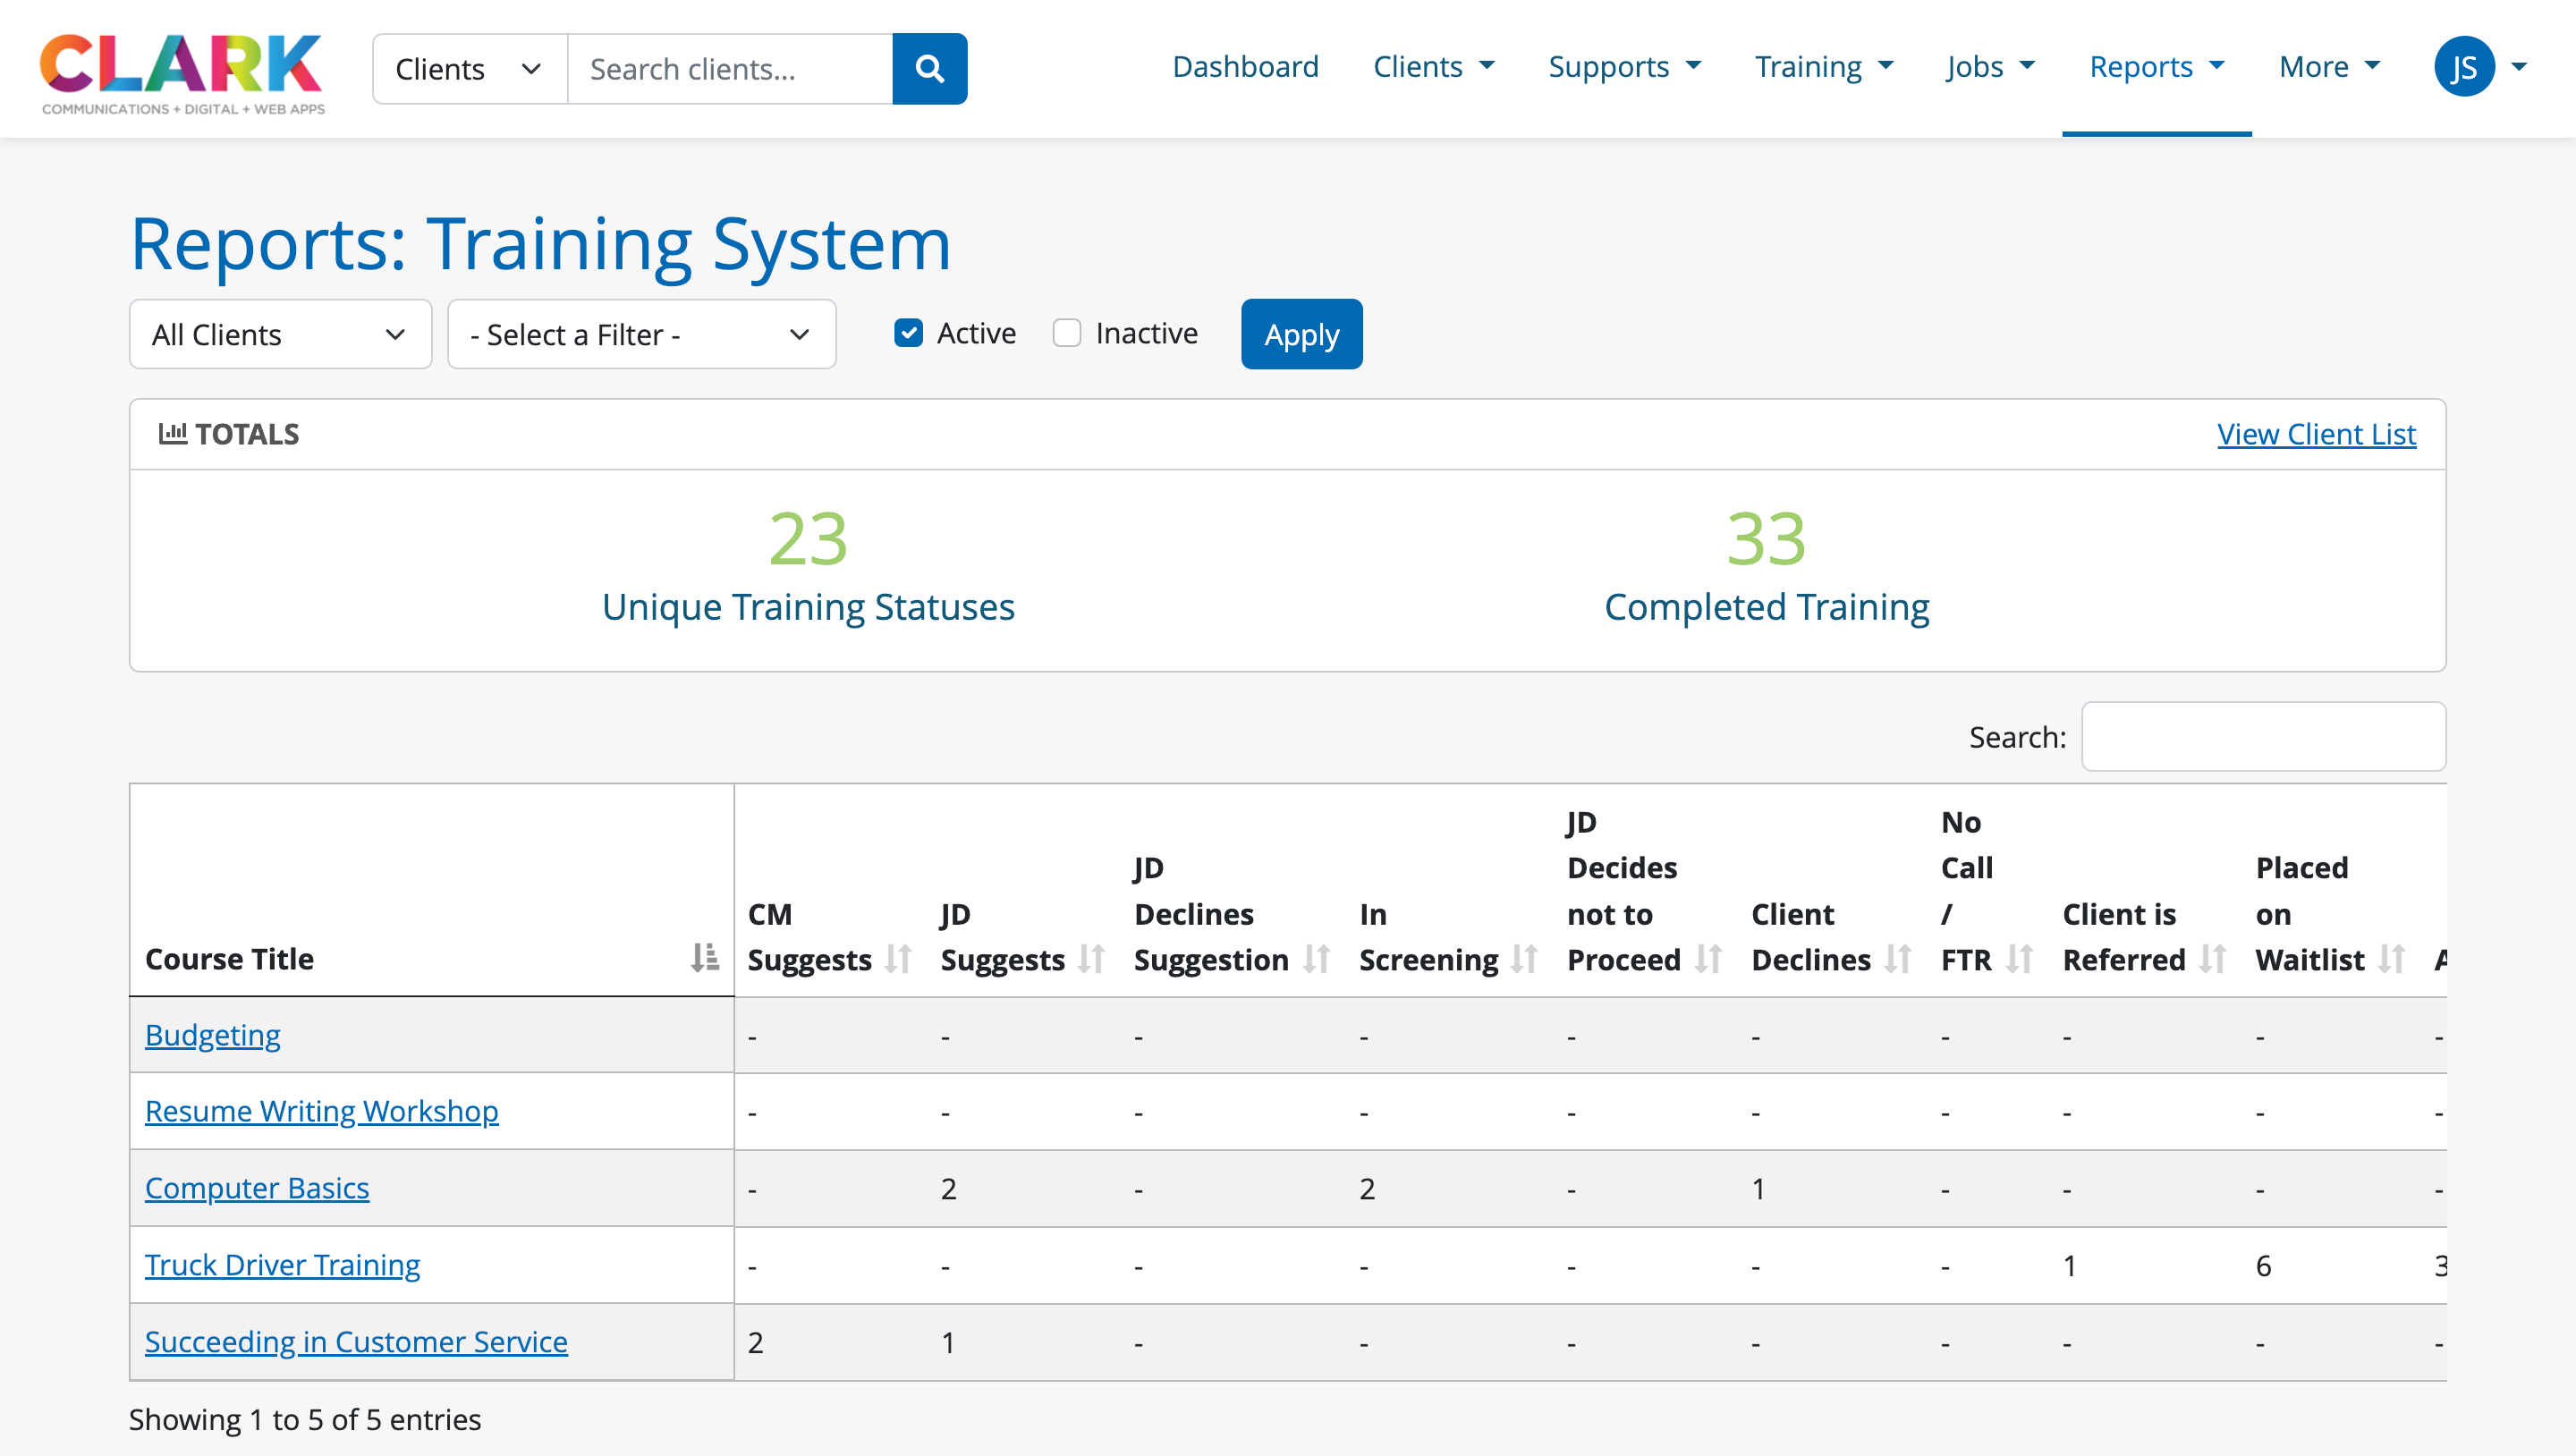
Training System
Training System displays a table that shows all training course statuses, the number of clients in each status for all active training courses in the system
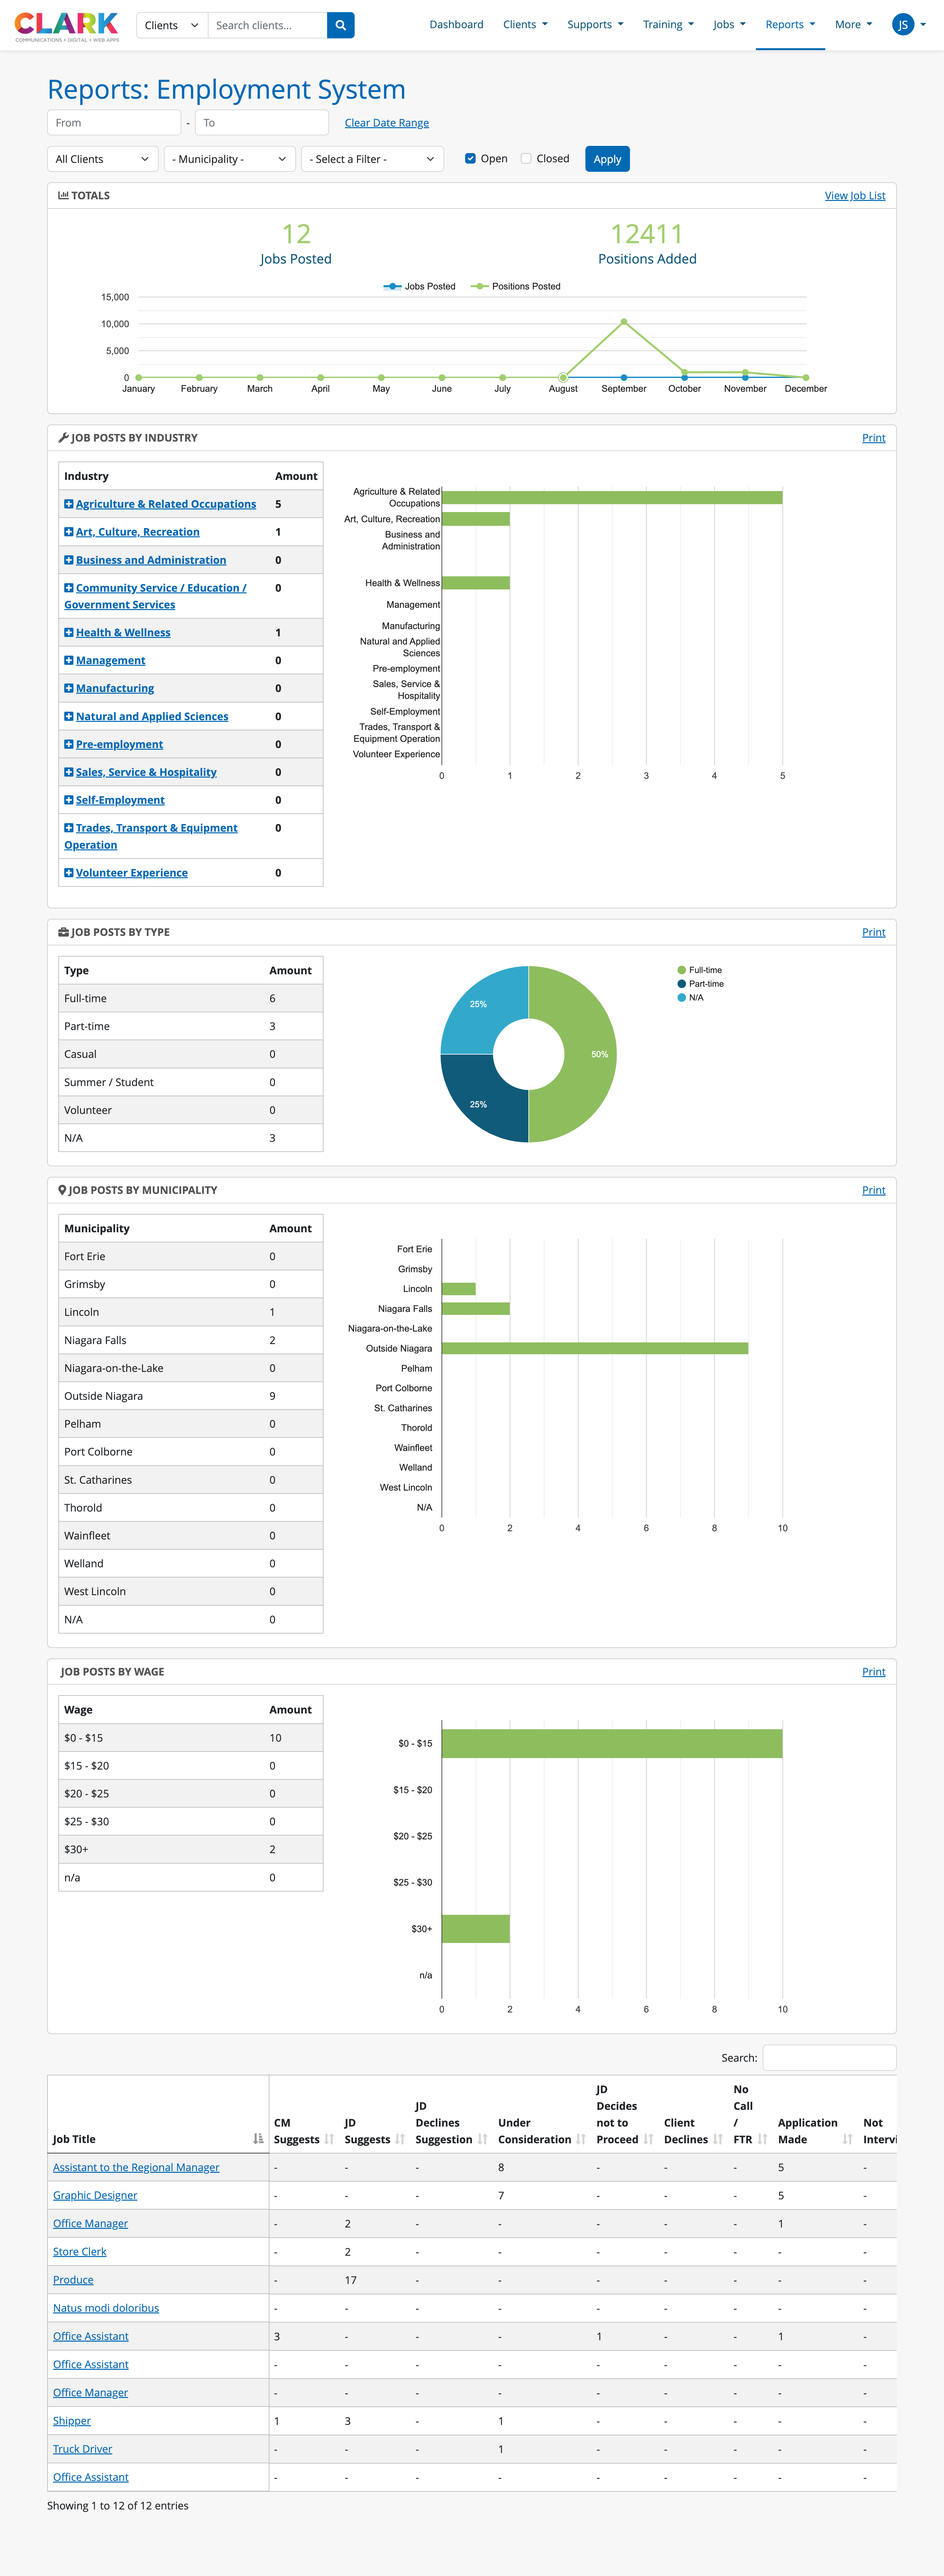
Employment System
Employment System shows tabular data and graphs for jobs posted and positions added, as well as:
Number of jobs posted by industry
Job types
Jobs by municipality
Job wage ranges
Also includes a table showing all job statuses, the number of clients in each status for all active jobs in the system.
Employers & Jobs Starts
Employers & Jobs Starts shows tabular data and a line graph for new hires per employer